Pawan Jangra
  • Home
  • About
  • Content
    • 📊 Data Visualizations
    • ✍️ Blog
    • 📄 Articles
    • 📚 Statistics with R
  • Skills & Projects
Categories
All (5)
Data Cleaning (1)
Data Viz (2)
Field Research (1)
ggplot2 (3)
R (2)
R Programming (1)
Statistics (1)
Survey (1)
Tidyverse (1)
Visualization (1)

Blog

R
ggplot2
data.table
Quarto
Survey
R programming, data analysis, survey methodology, and data storytelling for Indian economic research.
Writing

Blog

R programming, data analysis, survey methodology, and data storytelling for Indian economic research.


Rggplot2data.tableQuartoSurvey

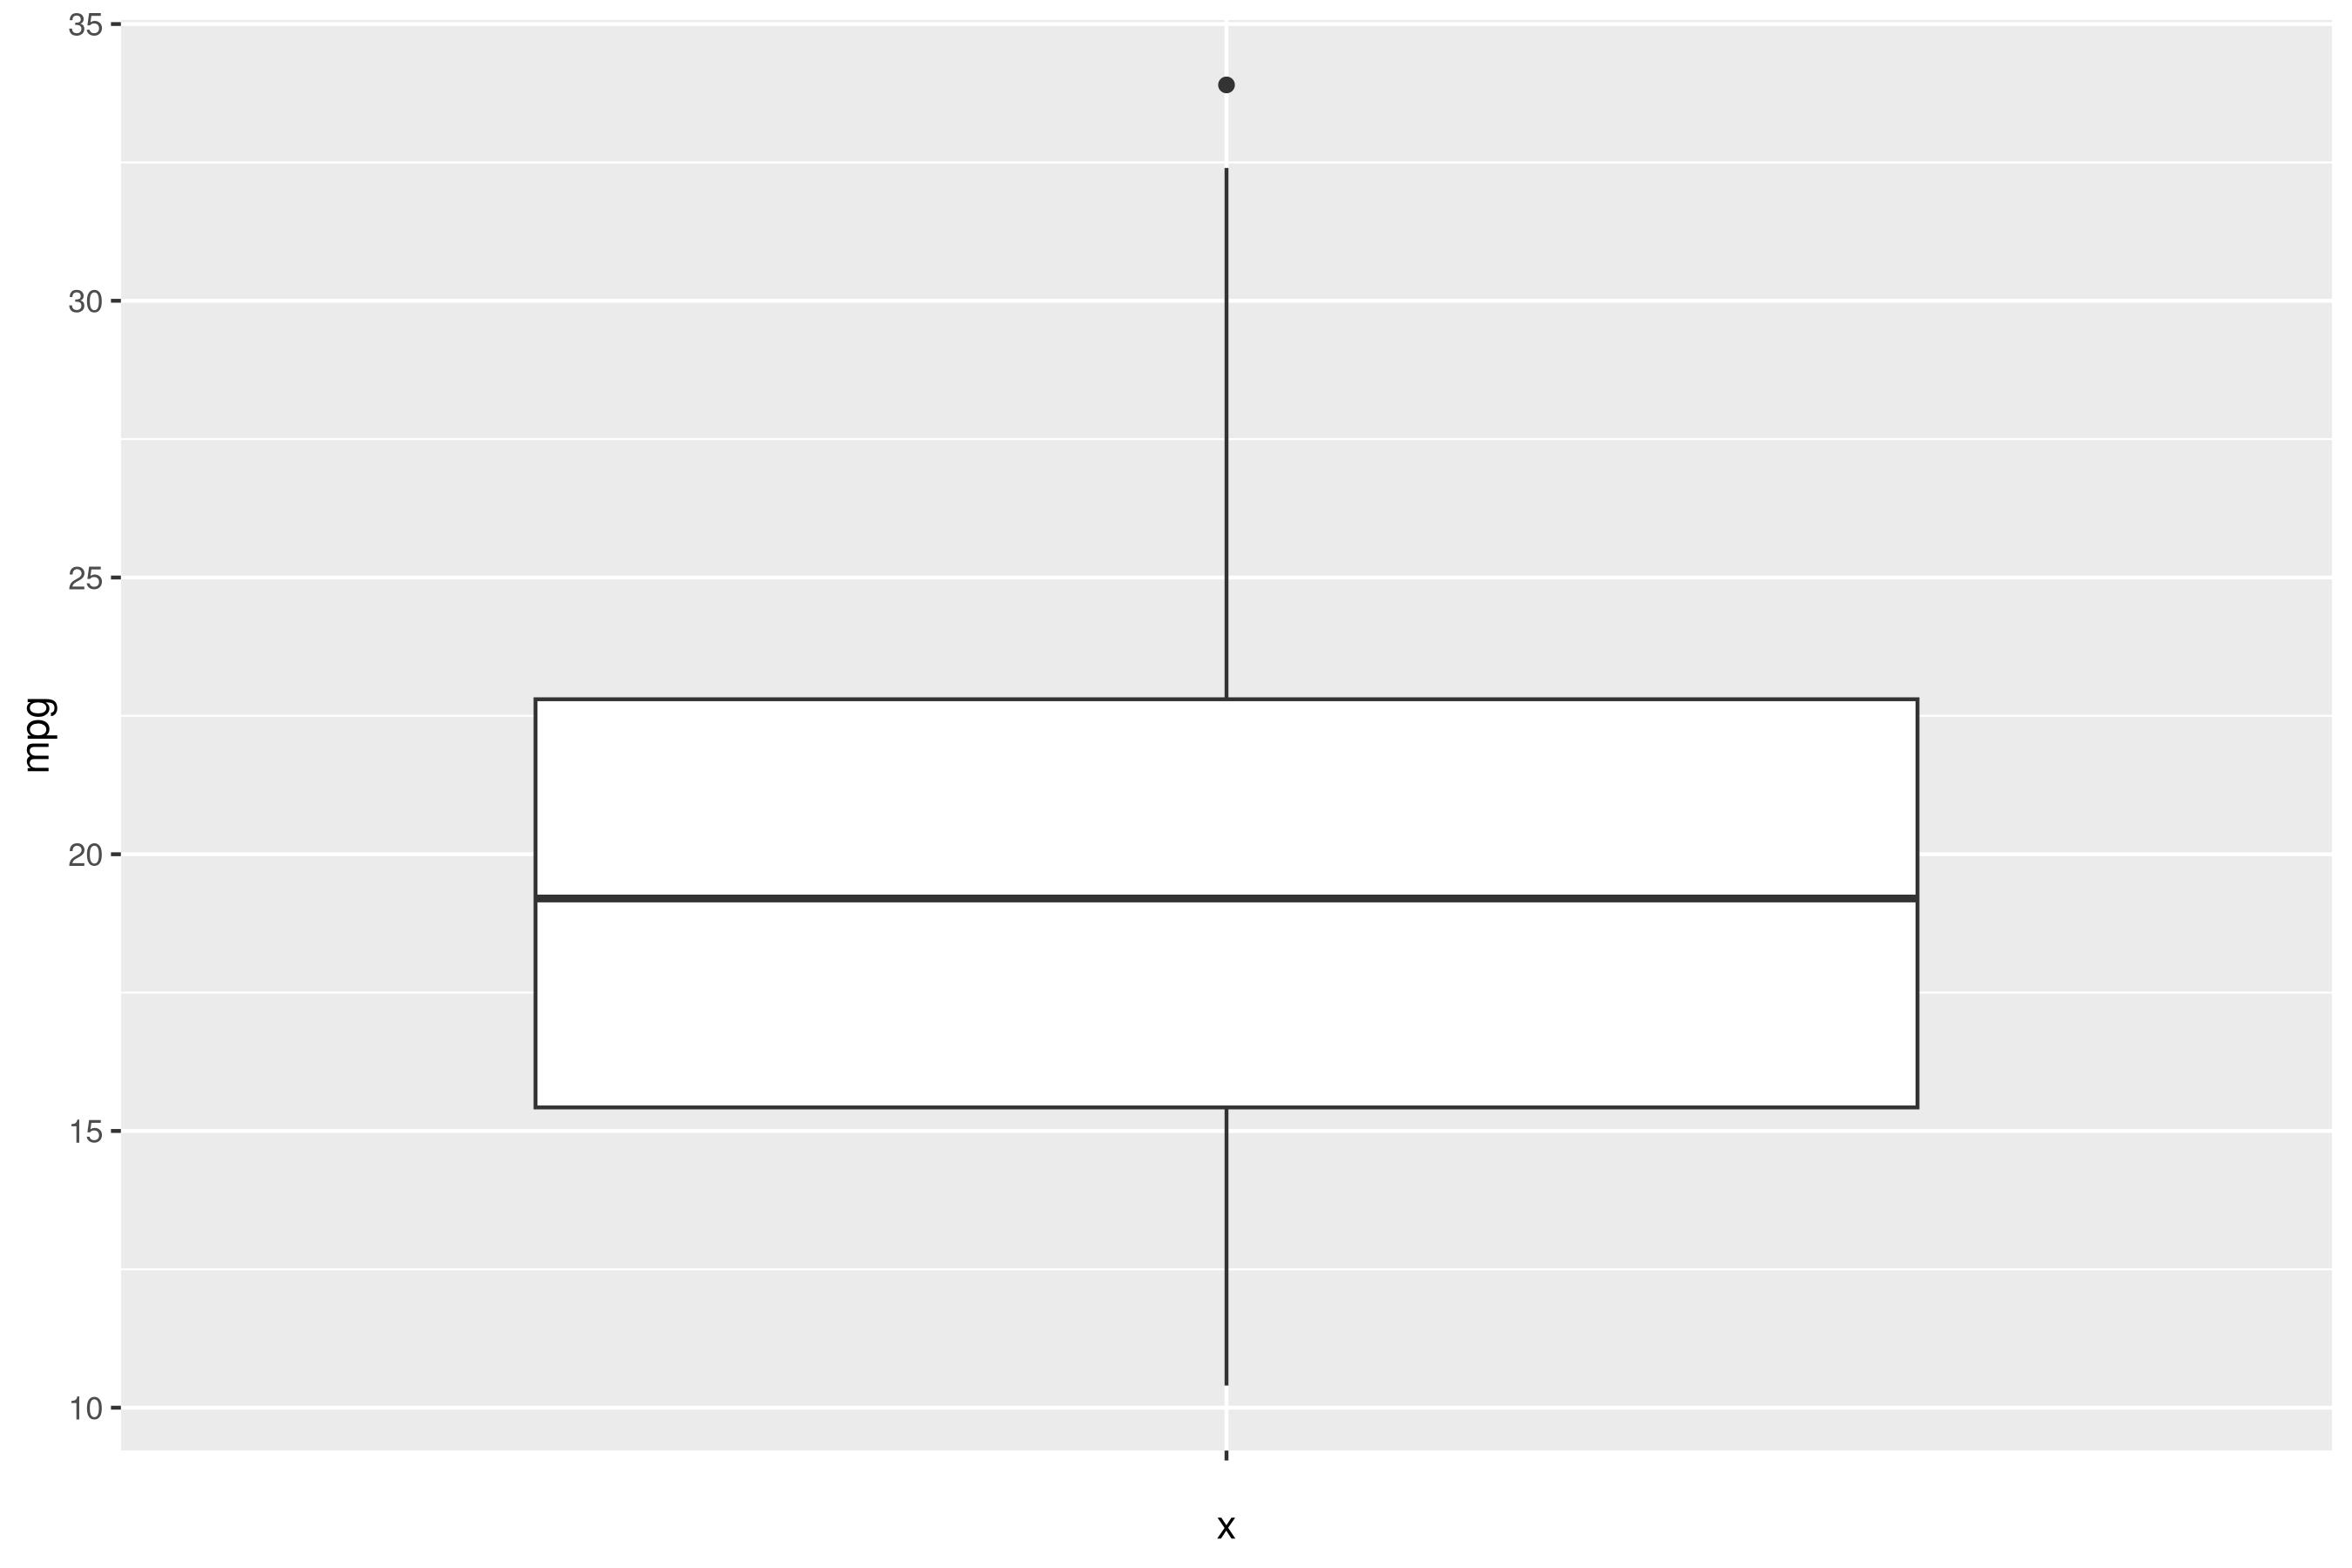
Combining plots in ggplot2
8 min
Data Viz
ggplot2
The ggplot2 package doesn’t providing function to arrange multiples plots in a single figure, but there are some packages, that allow combine multiples plots into a single…
 
The Advantages of R for Statistical Analysis
7 min
Data Viz
ggplot2
R Programming
R has emerged as one of the most powerful and versatile programming languages in data analysis and statistical computing. It’s Developed by statisticians for statisticians…

Data Wrangling with tidyverse: A Practical Guide
4 min
R
Tidyverse
Data Cleaning

Learn how to efficiently wrangle messy datasets using dplyr, tidyr, and readr with real-world survey data examples.

15 Jun 2025

Sampling Methods in Field Research: What I Learned
5 min
Survey
Statistics
Field Research

From stratified to cluster sampling — practical insights from 7 years of field survey work across India.

10 May 2025

Beautiful Statistical Graphics with ggplot2
5 min
R
ggplot2
Visualization

A step-by-step guide to creating publication-quality charts using ggplot2, including themes, annotations, and color scales.

20 Apr 2025
No matching items

© 2025 Pawan Jangra

  • Built with Quarto