Measures of central tendency, dispersion, shape, and exploratory data analysis with R.
Author
Pawan Jangra
Published
January 10, 2025
Learning Objectives: By the end of this chapter, you will be able to compute and interpret measures of central tendency and dispersion, create effective visualizations for exploring distributions, and identify skewness and outliers in real datasets.
1 Introduction to Descriptive Statistics
Descriptive statistics summarize and describe the main features of a dataset. They are the first step in any data analysis — before we run a single regression or hypothesis test, we must understand what our data looks like.
In R, we have powerful tools for this. Let’s load our packages and create a realistic dataset:
library(tidyverse)library(knitr)# Simulate Labour Force Survey dataset.seed(2025)n <-1000lfs_data <-data.frame(age =round(rnorm(n, 35, 12)) |>pmax(15) |>pmin(70),wage =exp(rnorm(n, log(400), 0.7)) |>round(),edu_years =sample(0:20, n, replace =TRUE, prob =dpois(0:20, 8) +0.01),gender =sample(c("Male","Female"), n, replace =TRUE, prob=c(.6,.4)),state =sample(c("Haryana","UP","Bihar","Maharashtra","Karnataka"), n, replace =TRUE),sector =sample(c("Agriculture","Industry","Services"), n, replace =TRUE, prob =c(.4,.2,.4)))glimpse(lfs_data)
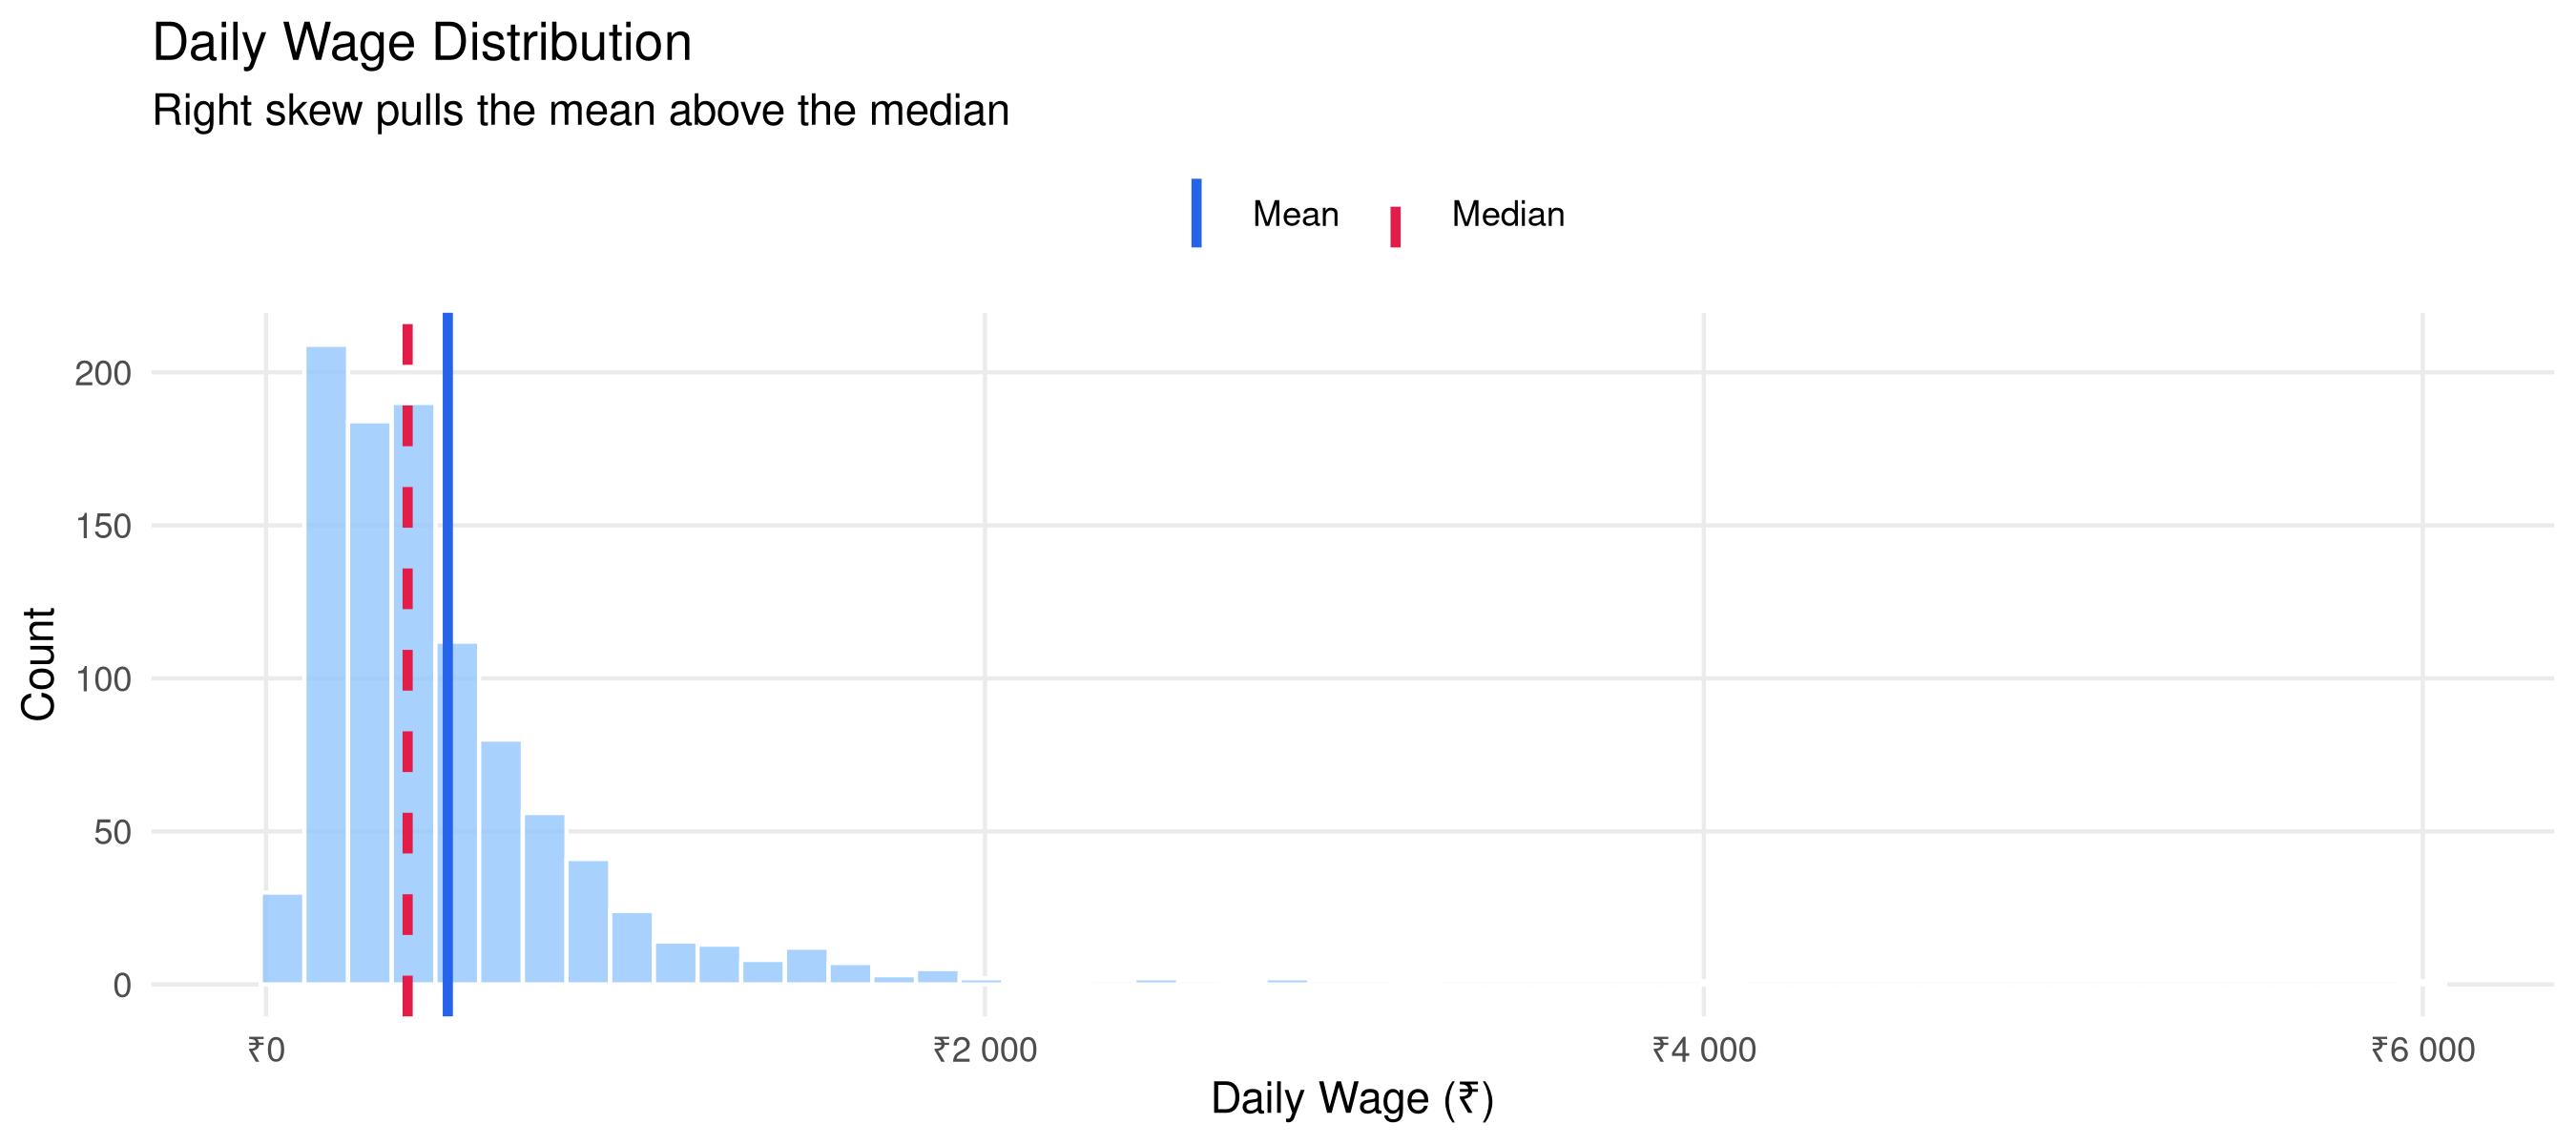
ggplot(lfs_data, aes(x = wage)) +geom_histogram(bins =50, fill ="#93c5fd", alpha =0.8, color ="white") +geom_vline(aes(xintercept =mean(wage), linetype ="Mean"), color ="#2563eb", linewidth =1.2) +geom_vline(aes(xintercept =median(wage), linetype ="Median"), color ="#e11d48", linewidth =1.2) +scale_linetype_manual(name ="", values =c("Mean"="solid","Median"="dashed")) +scale_x_continuous(labels = scales::label_number(prefix ="₹")) +labs(title ="Daily Wage Distribution",subtitle ="Right skew pulls the mean above the median",x ="Daily Wage (₹)", y ="Count") +theme_minimal(base_size =11) +theme(legend.position ="top", panel.grid.minor =element_blank())
Wage distribution showing mean vs median divergence due to right skew
Key insight: For right-skewed income distributions, the median is almost always a better measure of “typical” than the mean. A few high earners inflate the mean.
3 Measures of Dispersion
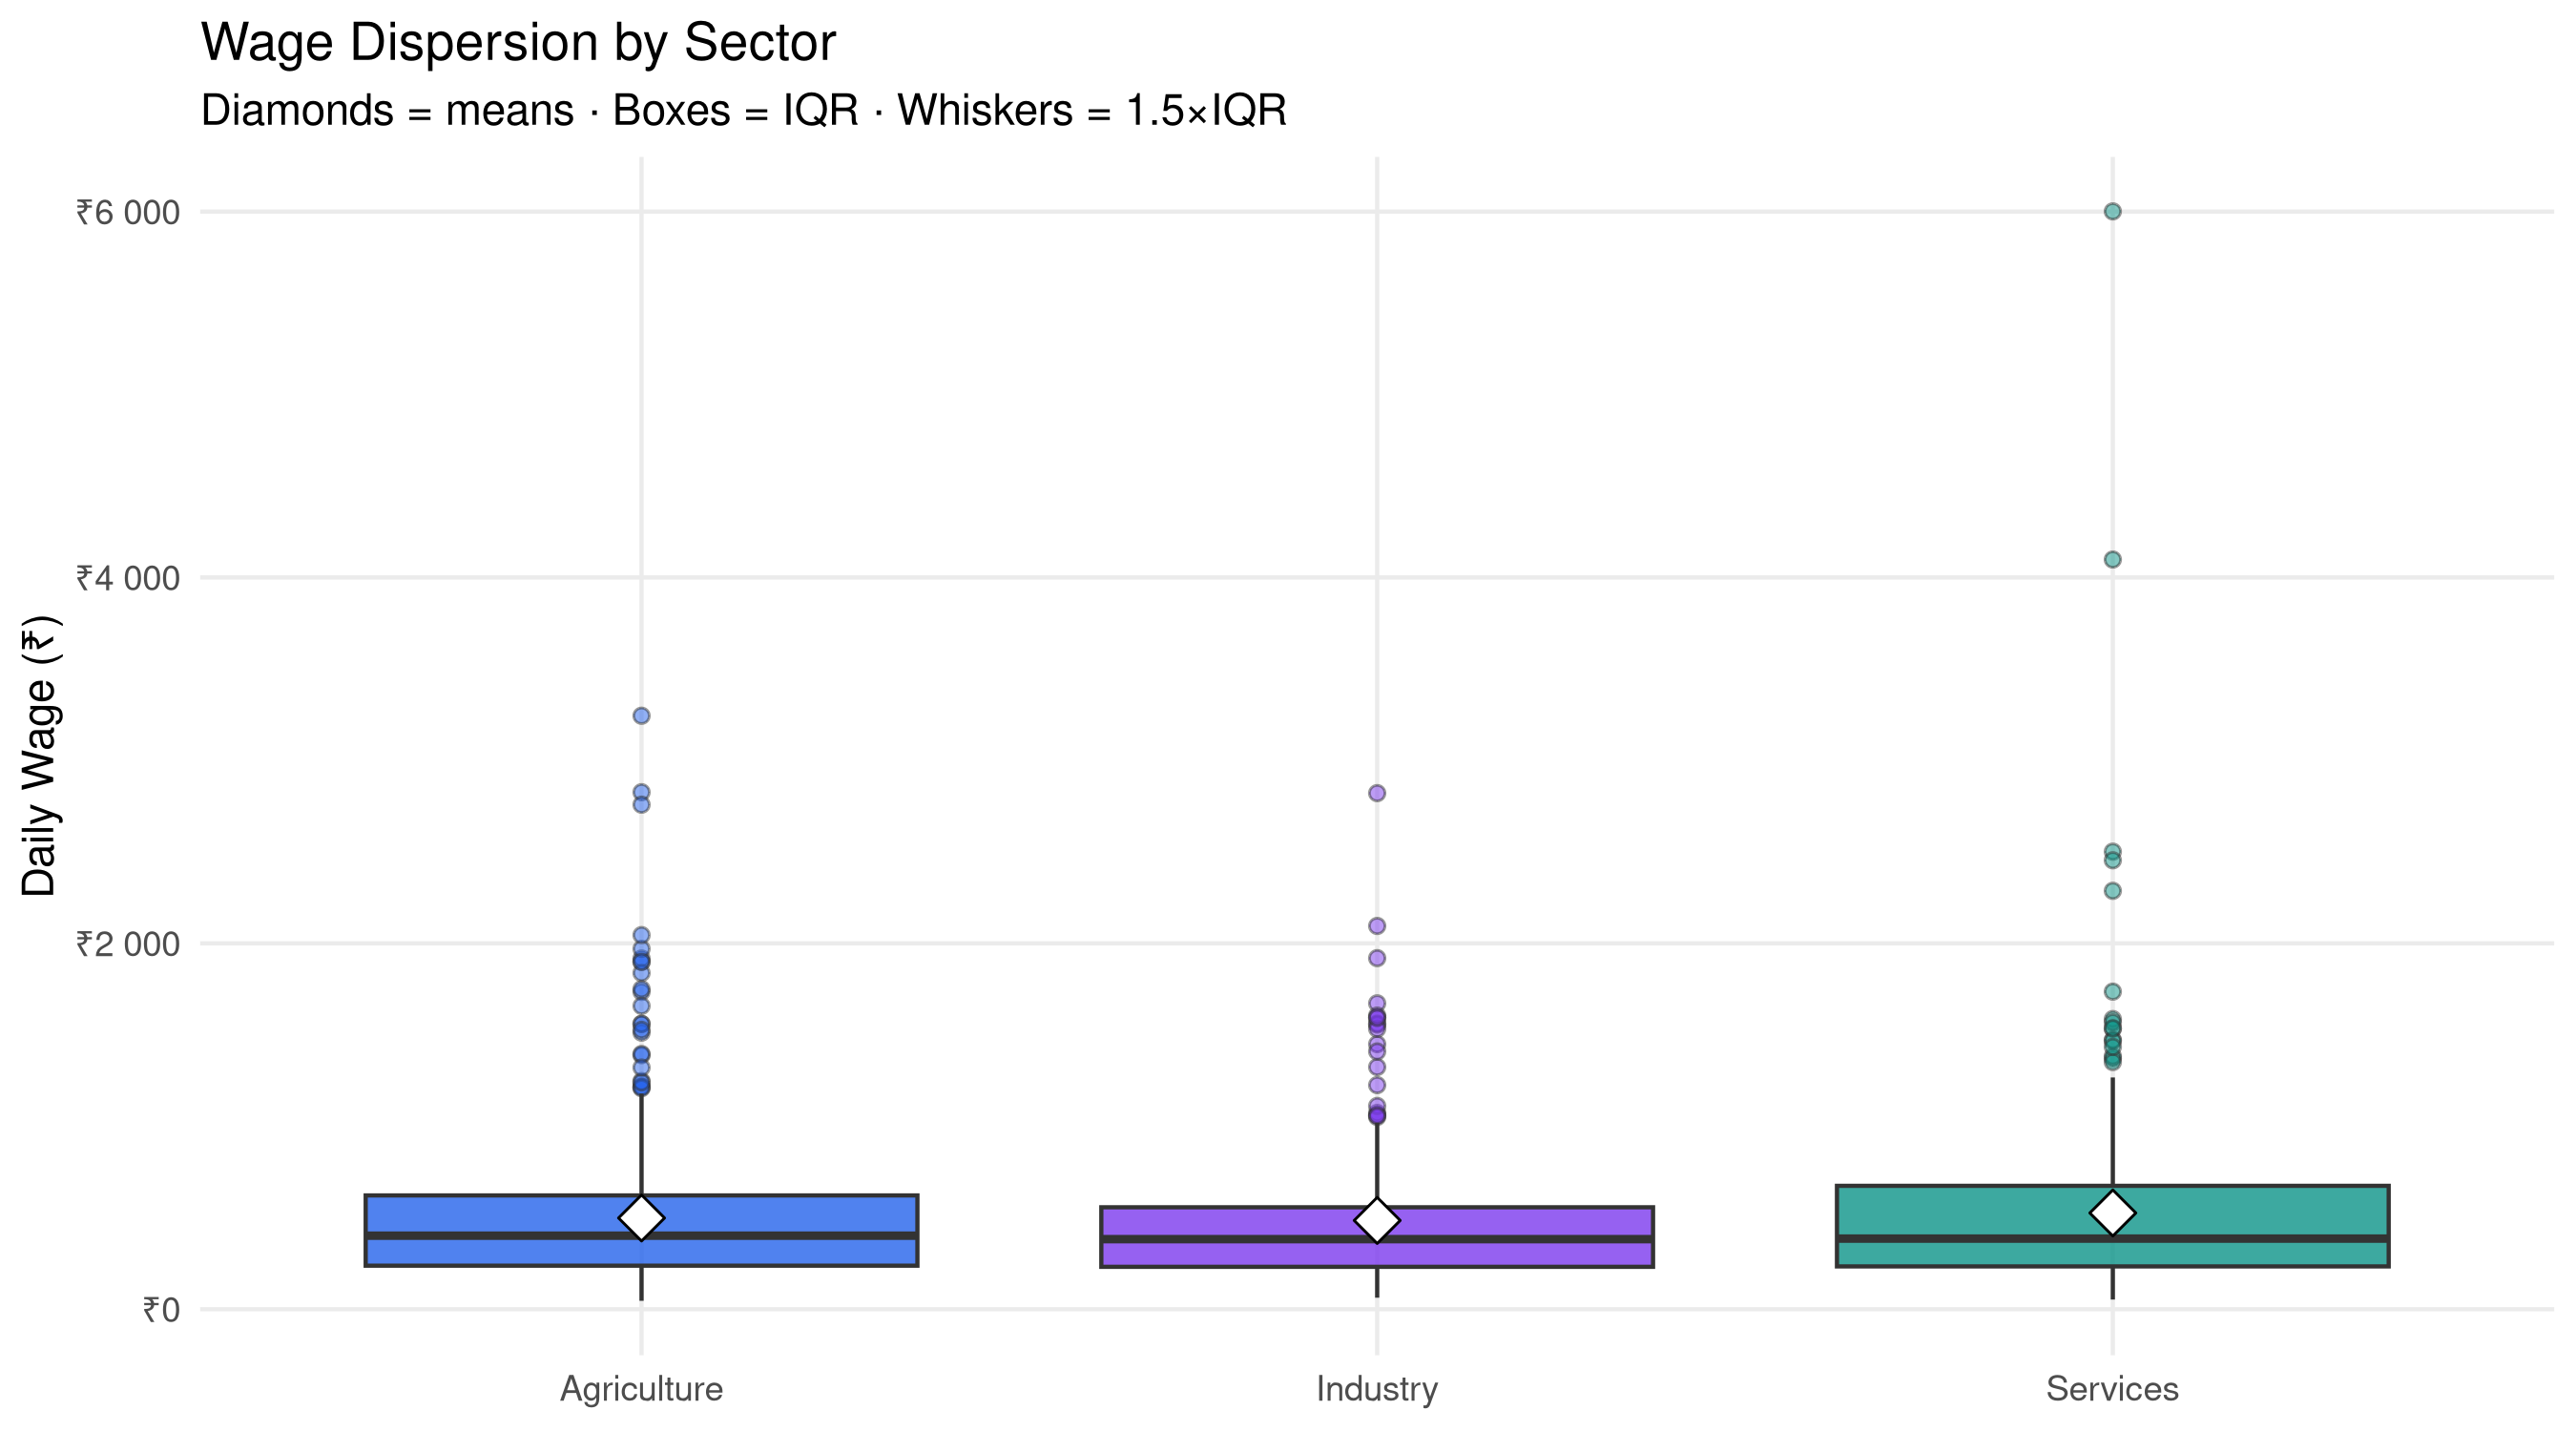
# Boxplot comparison across sectorsggplot(lfs_data, aes(x = sector, y = wage, fill = sector)) +geom_boxplot(alpha =0.8, outlier.shape =21, outlier.alpha =0.5,outlier.size =1.5) +stat_summary(fun = mean, geom ="point", shape =23, size =4, fill ="white", color ="black") +scale_fill_manual(values =c("#2563eb","#7c3aed","#0d9488")) +scale_y_continuous(labels = scales::label_number(prefix ="₹")) +labs(title ="Wage Dispersion by Sector",subtitle ="Diamonds = means · Boxes = IQR · Whiskers = 1.5×IQR",x =NULL, y ="Daily Wage (₹)") +theme_minimal(base_size =11) +theme(legend.position ="none", panel.grid.minor =element_blank())
Dispersion measures by sector (CV = Coefficient of Variation)
sector
n
Mean
SD
CV (%)
Median
IQR
Agriculture
423
499
406
81.4
402
384
Industry
214
485
400
82.3
383
326
Services
363
526
508
96.6
386
440
Coefficient of Variation (CV): Useful for comparing dispersion across groups with different means. CV = (SD / Mean) × 100%. Higher CV means more relative spread.
cat("That's", round(mean(lfs_outliers$is_outlier)*100, 1), "% of observations\n")
That's 5.4 % of observations
5 Cross-tabulation: Two-Way Frequencies
# Sector by state distributioncross_tab <- lfs_data |>count(sector, gender) |>pivot_wider(names_from = gender, values_from = n) |>mutate(Total = Male + Female,`Female Share (%)`=round(Female/Total*100, 1))kable(cross_tab, caption ="Employment distribution by sector and gender")
Employment distribution by sector and gender
sector
Female
Male
Total
Female Share (%)
Agriculture
189
234
423
44.7
Industry
94
120
214
43.9
Services
143
220
363
39.4
6 Practice Exercises
TipTry It Yourself
Compute the Gini coefficient for wage inequality using ineq package
Create a violin plot comparing wages across all 5 states
Test whether mean wages differ significantly between sectors using ANOVA
Compute the 90th percentile wage separately for male and female workers