Fertilizer Statistics

Trade
Fertilizer
Author

Pawan

Published

November 26, 2025

Modified

December 22, 2025

Code
library(data.table)
library(ggplot2)
options(scipen=99999)
library(showtext)
library(tidyr)
library(dplyr)

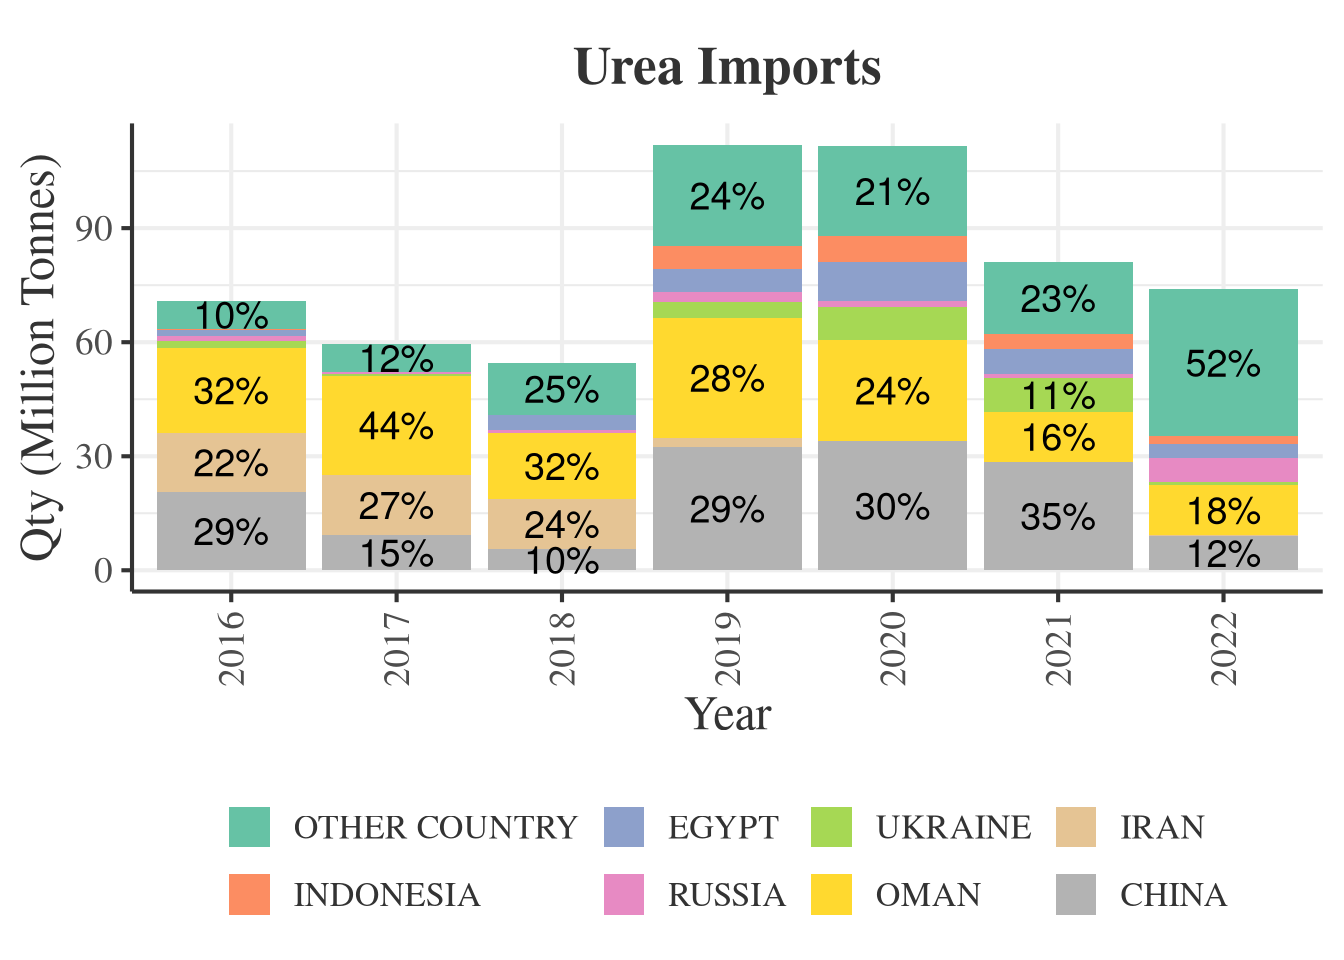
readRDS("/home/pawan/fertilizer/urea_importqty.rds")->t1
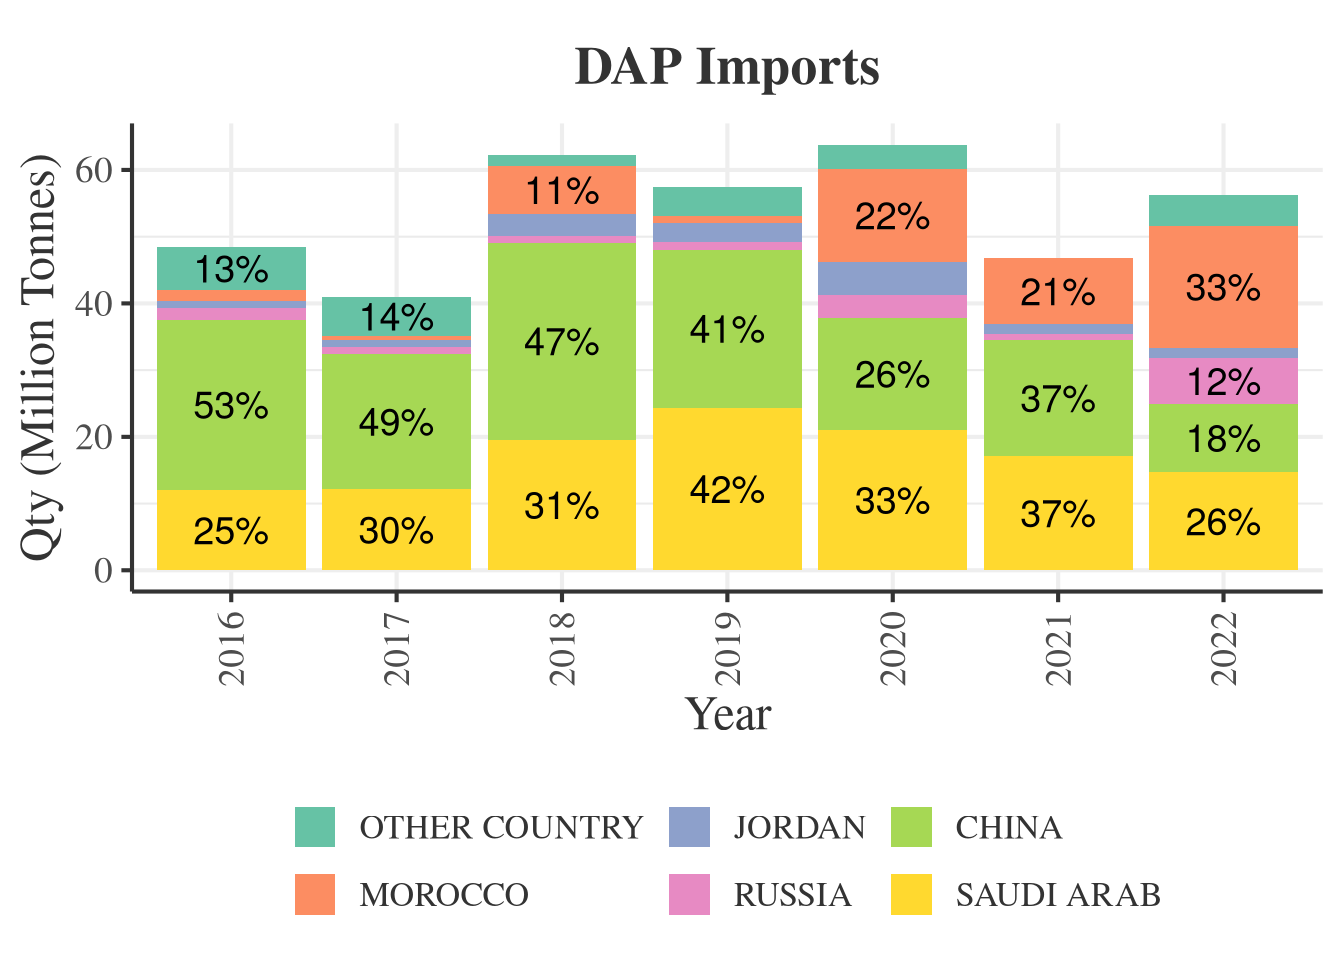
readRDS("/home/pawan/fertilizer/dap_importqty.rds")->t2
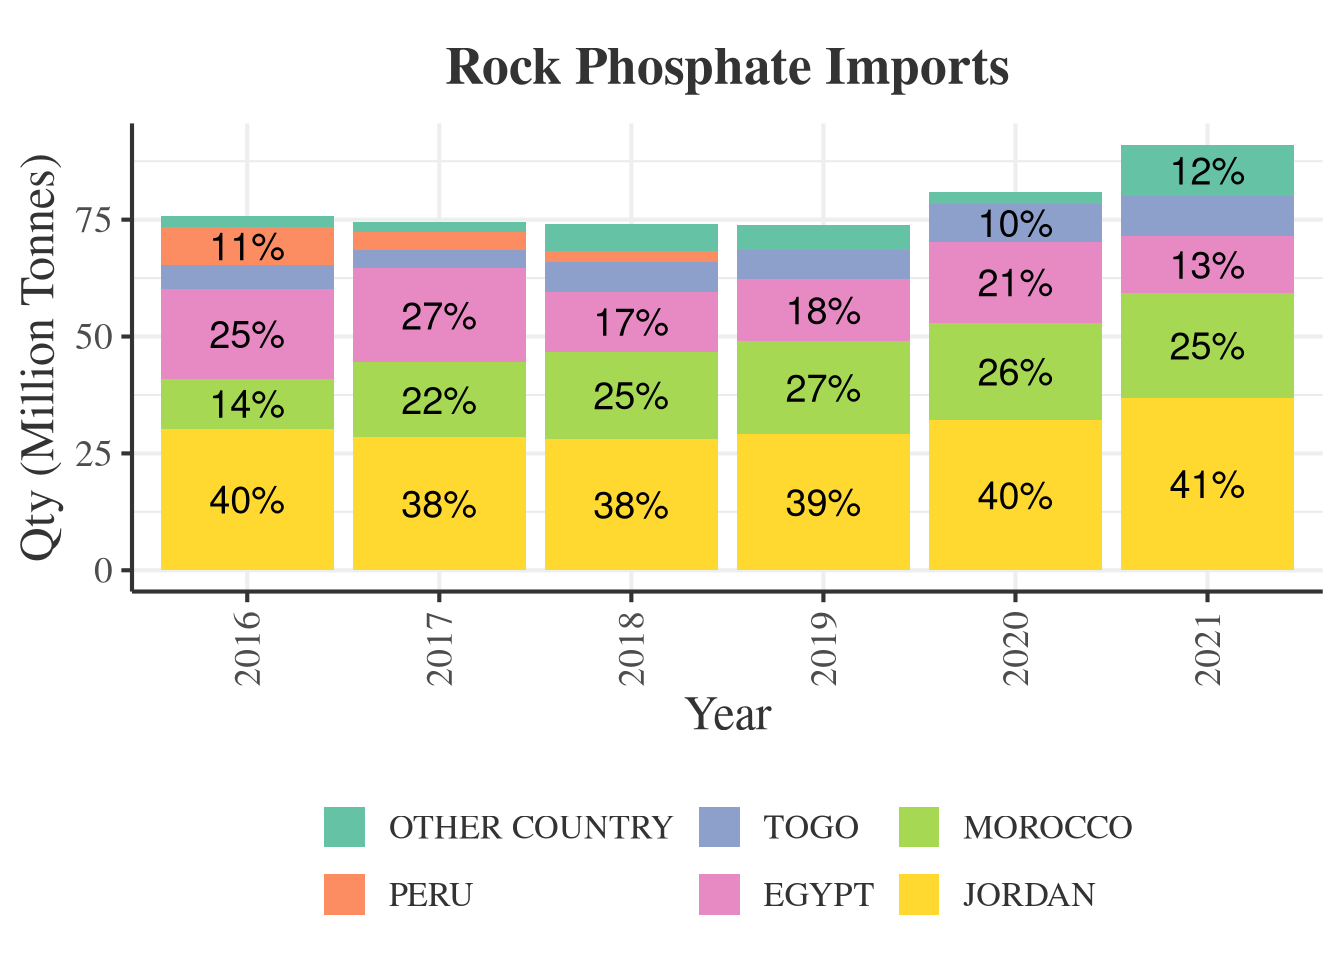
readRDS("/home/pawan/fertilizer/rock_phosphate_importqty.rds")->t3
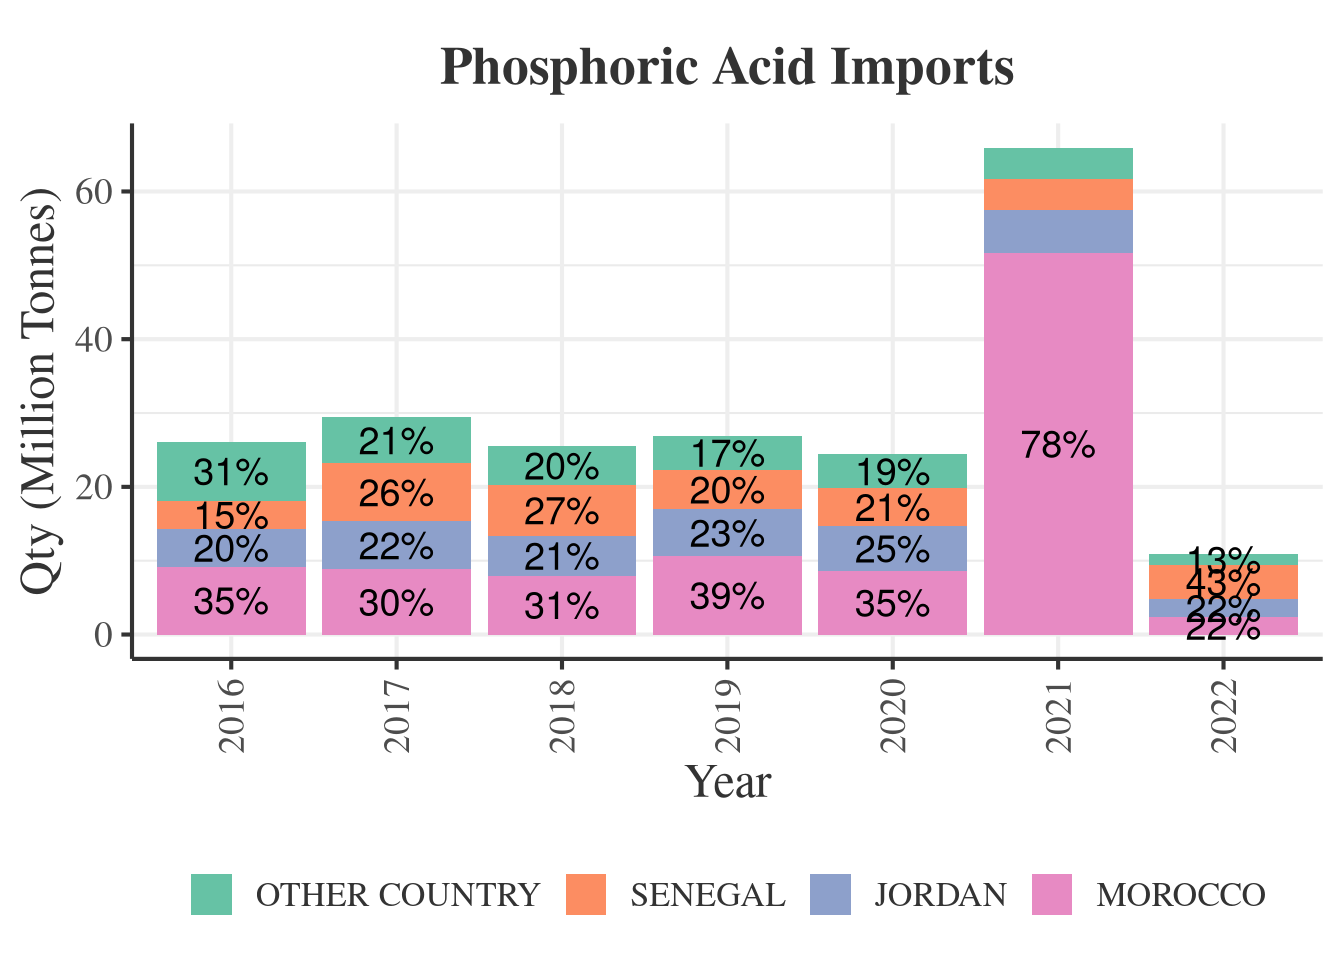
readRDS("/home/pawan/fertilizer/phosphoric_acid_importqty.rds")->t4
readRDS("/home/pawan/fertilizer/potash_importqty.rds")->t5

gsub(",","", t1$ImportMonth)->t1$ImportMonth
gsub(",","", t2$ImportMonth)->t2$ImportMonth
gsub(",","", t3$ImportMonth)->t3$ImportMonth
gsub(",","", t4$ImportMonth)->t4$ImportMonth
gsub(",","", t5$ImportMonth)->t5$ImportMonth

t1[Country == "Total" ,.(Qty = sum(as.numeric(ImportMonth),
                                     na.rm = TRUE)) ,.(Country, Year, Month)]->urea

urea[,Date:=as.Date(paste(Year,"-",Month,"-",15,sep=""),"%Y-%b-%d")]
t1[,.(sum(as.numeric(ImportMonth),
            na.rm=TRUE)) ,.(Year, Country)]->a
##as.data.frame(a[order(Year,V1)])
t2[Country == "Total" ,.(Qty = sum(as.numeric(ImportMonth),
                                     na.rm = TRUE)) ,.(Country, Year, Month)]->dap
dap[,Date:=as.Date(paste(Year,"-",Month,"-",15,sep=""),"%Y-%b-%d")]
t5[Country=="Total",.(Qty=sum(as.numeric(ImportMonth),na.rm=TRUE)),.(Country,Year,Month)]->mop

t1[Country != "Total" ,.(Qty = sum(as.numeric(ImportMonth),
                                     na.rm = TRUE)) ,.(Country, Year)]->t1
t2[Country != "Total" ,.(Qty = sum(as.numeric(ImportMonth),
                                     na.rm = TRUE)) ,.(Country, Year)]->t2
t3[Country != "Total" ,.(Qty = sum(as.numeric(ImportMonth),
                                     na.rm = TRUE)) ,.(Country, Year)]->t3
t4[Country != "Total" ,.(Qty = sum(as.numeric(ImportMonth),
                                     na.rm = TRUE)) ,.(Country, Year)]->t4
t5[Country != "Total" ,.(Qty = sum(as.numeric(ImportMonth),
                                     na.rm = TRUE)) ,.(Country, Year)]->t5

t1[Country == "CHINA P RP", Country := "CHINA"]
t1[Country == "EGYPT A RP", Country := "EGYPT"]
t1[Country != "CHINA" & Country != "OMAN" &
             Country != "IRAN" & Country != "UKRAINE" &
         Country != "EGYPT" & Country != "RUSSIA" &
                   Country != "INDONESIA", Country := "OTHER COUNTRY"]

factor(t1$Country, levels = c("OTHER COUNTRY", "INDONESIA", "EGYPT",
                                "RUSSIA", "UKRAINE", "OMAN",
                                "IRAN", "CHINA"))->t1$Country

  t2[Country == "CHINA P RP", Country := "CHINA"]
  t2[Country != "CHINA" & Country != "SAUDI ARAB" &
     Country != "MOROCCO" & Country != "JORDAN" &
     Country != "RUSSIA", Country := "OTHER COUNTRY"]
  factor(t2$Country, levels = c("OTHER COUNTRY", "MOROCCO",
                                "JORDAN", "RUSSIA",
                                "CHINA", "SAUDI ARAB"))->t2$Country

  t3[Country == "EGYPT A RP", Country := "EGYPT"]
  t3[Country != "EGYPT" & Country != "JORDAN" &
     Country != "MOROCCO" & Country != "PERU" &
     Country != "TOGO", Country := "OTHER COUNTRY"]
  factor(t3$Country, levels = c("OTHER COUNTRY", "PERU", "TOGO",
                                "EGYPT", "MOROCCO", "JORDAN"))->t3$Country

  t4[Country != "MOROCCO" & Country != "JORDAN" &
     Country != "SENEGAL", Country := "OTHER COUNTRY"]
factor(t4$Country, levels = c("OTHER COUNTRY", "SENEGAL",
                               "JORDAN", "MOROCCO"))->t4$Country

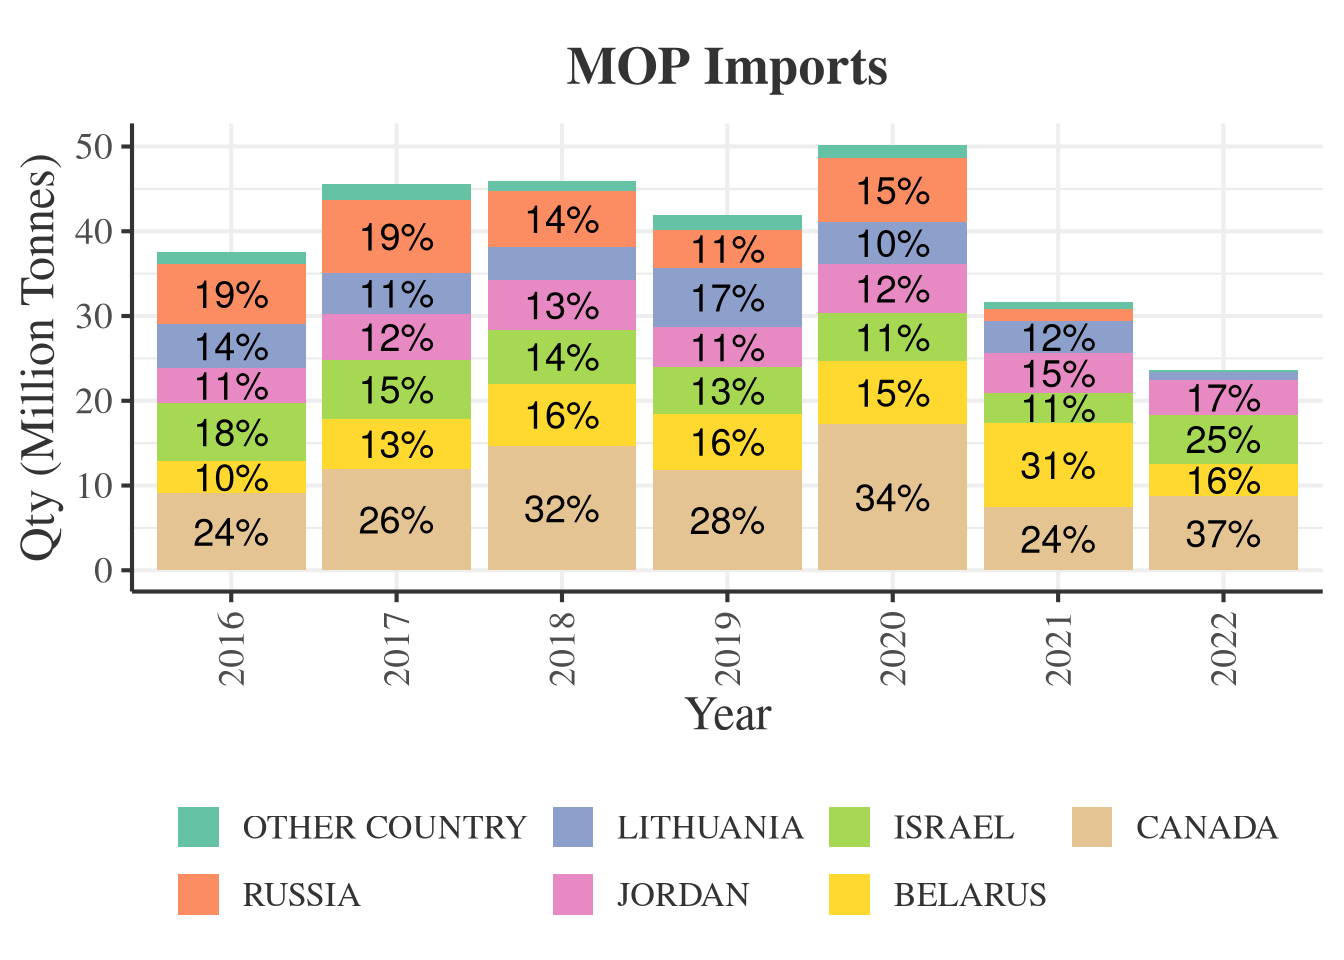
t5[Country != "CANADA" & Country !="BELARUS" &
   Country != "ISRAEL" & Country != "JORDAN" &
   Country != "LITHUANIA" & Country != "RUSSIA",
   Country := "OTHER COUNTRY"]

factor(t5$Country, levels = c("OTHER COUNTRY", "RUSSIA", "LITHUANIA",
                                "JORDAN", "ISRAEL", "BELARUS",                                
                                "CANADA"))->t5$Country

t1[, Qty := Qty/100000][Year>"2015" ,.(Qty = sum(Qty)) ,.(Country, Year)]->t1
t2[, Qty := Qty/100000][Year>"2015" ,.(Qty = sum(Qty)) ,.(Country, Year)]->t2
t3[, Qty := Qty/100000][Year>"2015" ,.(Qty = sum(Qty)) ,.(Country, Year)]->t3
t4[, Qty := Qty/100000][Year>"2015" ,.(Qty = sum(Qty)) ,.(Country, Year)]->t4
t5[, Qty := Qty/100000][Year>"2015" ,.(Qty = sum(Qty)) ,.(Country, Year)]->t5

t1[ ,.(Percent = round(Qty*100/sum(Qty)), Country, Qty) ,.(Year)]->t1
t2[ ,.(Percent = round(Qty*100/sum(Qty)), Country, Qty) ,.(Year)]->t2
t3[ ,.(Percent = round(Qty*100/sum(Qty)), Country, Qty) ,.(Year)]->t3
t4[ ,.(Percent = round(Qty*100/sum(Qty)), Country, Qty) ,.(Year)]->t4
t5[ ,.(Percent = round(Qty*100/sum(Qty)), Country, Qty) ,.(Year)]->t5
Code
my_theme <- theme_bw(base_size = 16) +  ## Start with theme_bw and increase base size
      theme(text = element_text(family = "serif", color = "#333333"), ## Set font family and color
            plot.title = element_text(size = 20, face = "bold",
                                      hjust = 0.5, margin = margin(10, 0, 10, 0)), ## Center and style title
            axis.title = element_text(size = 18),
            axis.text = element_text(size = 14),
            legend.position = "bottom",
            legend.title = element_blank(),  ## Remove legend title
            panel.grid.major = element_line(color = "#EEEEEE"), ## Lighter grid lines
            panel.border = element_blank(), ## Remove panel border
            axis.line = element_line(color = "#333333"), ## Add axis lines
            axis.text.x = element_text(angle = 90, vjust = 0.5, hjust=1),
            strip.background = element_rect(fill = "#F2F2F2", color = NA) ## Style facet strips (if used)
            )

Urea Import

Code
  ggplot(t1, aes(x = Year, y = Qty, fill = Country)) +
      geom_bar(stat = "identity", position = "stack") +
      geom_text(aes(x = Year, y = Qty, label = ifelse(Percent<10, "", paste0(Percent, "%"))),
                position = position_stack(vjust = 0.5), size = 5, color = "black") +
      scale_fill_brewer(palette = "Set2") + ## Set bar color
      my_theme +
      scale_y_continuous(labels = scales::label_comma()) +
      ggtitle("Urea Imports") +
      labs(y = "Qty (Million Tonnes)")->p1
  p1

DAP Import

Code
  ggplot(t2, aes(x = Year, y = Qty, fill = Country)) +
      geom_bar(stat = "identity", position = "stack") +
      geom_text(aes(x = Year, y = Qty, label = ifelse(Percent<10, "", paste0(Percent, "%"))),
                position = position_stack(vjust = 0.5), size = 5, color = "black") +
      scale_fill_brewer(palette = "Set2") + ## Set bar color
      my_theme +
      scale_y_continuous(labels = scales::label_comma()) +
      ggtitle("DAP Imports") +
      labs(y = "Qty (Million Tonnes)")->p2
  p2

Rock Phosphate Import

Code
   ggplot(t3, aes(x = Year, y = Qty, fill = Country)) +
      geom_bar(stat = "identity", position = "stack") +
      geom_text(aes(x = Year, y = Qty, label = ifelse(Percent<10, "", paste0(Percent, "%"))),
                position = position_stack(vjust = 0.5), size = 5, color = "black") +
      scale_fill_brewer(palette = "Set2") + ## Set bar color
      my_theme +
      scale_y_continuous(labels = scales::label_comma()) +
      ggtitle("Rock Phosphate Imports") +
      labs(y = "Qty (Million Tonnes)")->p3
  p3

Phosphoric Acid Imports

Code
  ggplot(t4, aes(x = Year, y = Qty, fill = Country)) +
      geom_bar(stat = "identity", position = "stack") +
      geom_text(aes(x = Year, y = Qty, label = ifelse(Percent<10, "", paste0(Percent, "%"))),
                position = position_stack(vjust = 0.5), size = 5, color = "black") +
      scale_fill_brewer(palette = "Set2") + ## Set bar color
      my_theme +
      scale_y_continuous(labels = scales::label_comma()) +
      ggtitle("Phosphoric Acid Imports") +
      labs(y = "Qty (Million Tonnes)")->p4
  p4

MOP Imports

Code
ggplot(t5, aes(x = Year, y = Qty, fill = Country)) +
    geom_bar(stat = "identity", position = "stack") +
    geom_text(aes(x = Year, y = Qty, label = ifelse(Percent<10, "", paste0(Percent, "%"))),
              position = position_stack(vjust = 0.5), size = 5, color = "black") +
    scale_fill_brewer(palette = "Set2") + ## Set bar color
    my_theme +
    scale_y_continuous(labels = scales::label_comma()) +
    ggtitle("MOP Imports") +
    labs(y = "Qty (Million Tonnes)")->p5
p5

International Fertilizer Price

Code
  fread("/home/pawan/fertilizer/international_fert_price.csv")->price
  paste("20", price$Year, sep = "")->price$Year
  substr(price$Month, 1, 3)->price$Month
  price[, Date:=as.Date(paste(Year, "-", Month, "-", 20, sep = ""),
                        format = "%Y-%b-%d")]
  
  melt(price, id = c("Month", "Year", "Date"))->price
  price[variable %in% c("Urea", "DAP", "MOP")]->price

  ggplot(price, aes(x = Date, y = value, color = variable)) +
      geom_line(size=1) + facet_wrap(~variable) +
      my_theme +
      labs(y = "Price (USD/MT)", x = "Month",
           title = "Fertilizer International Price") +
      scale_x_date(date_labels = "%b, %y", date_breaks = "6 months")->p
  p

Fertilizer Production

Urea and DAP production by India

Code
readRDS("/home/pawan/fertilizer/production-import/fert_production_import.RDS")->fert
fert[Year!="Total"]->fert
fert[,Date:=as.Date(paste(Year,"-",Month,"-",15,sep=""),"%Y-%b-%d")]
melt(fert,id=c("Year","Month","Date"))->fert
fert[variable!="SNo"&variable!="Blank"]->fert
separate(fert,variable,into=c("Fertilizer","Variable"),sep="_")->fert
setDT(fert)
fert[Variable=="Production"]->prod
fert[Variable=="Import"]->import

fread("/home/pawan/fertilizer/production-import.csv")->fert1
fert1[,Date:=as.Date(paste(Year,"-",Month,"-",15,sep=""),"%Y-%b-%d")]
melt(fert1,id=c("Year","Month","Date","Fertilizer"))->fert1
fert1[variable == "Production_Achievement", variable := "Production"]
fert1[variable == "Production"]->prod1
fert1[variable == "Import"]->import1

prod[,value:=value/100000]
as.numeric(prod$Year)->prod$Year
as.numeric(prod1$Year)->prod1$Year

rbind(
    prod[Year<2018,.(Year,Month,Date,Fertilizer,value)],
    prod1[,.(Year,Month,Date,Fertilizer,value)])->t

t[Fertilizer=="Urea"|Fertilizer=="DAP"]->t
t[!is.na(value)]->t
t[Year!="2025",.(Qty=sum(value)),.(Year,Fertilizer)]->t
##t[,.(Percent=round(Qty*100/sum(Qty)),Variable,Qty),.(Year,Fertilizer)]->t


ggplot(t, aes(x = Year, y = Qty, color = Fertilizer)) +
    geom_line(linewidth = 1) +
    scale_fill_brewer(palette = "Set2") + ## Set bar color
    my_theme +
    facet_wrap(~Fertilizer, scales = "free", ncol = 1) +
    labs(y="Qty (Million Tonnes)",
         title = "Urea and DAP Production in India") +
    scale_x_continuous(breaks = seq(1990, 2025, 1))->p

p